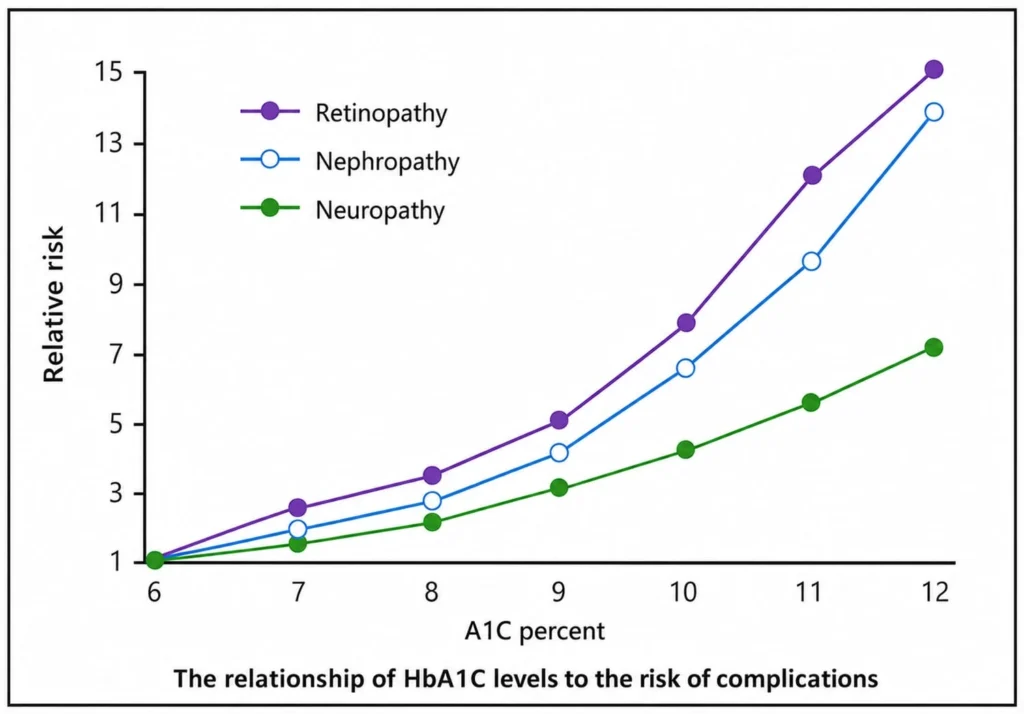
The HbA1C test shows how successful your sugar control program has been. This test shows what your average sugar level has been over the last 2 to 3 months, and by looking at it, the doctor can predict the health of your eyes, kidneys, and nervous system. Your HbA1C test should be 7 or less. If your daily sugar test record shows that your sugar remains normal, but the HbA1C test shows that your sugar level has been high, then you have to consider where the problem lies.
How Does the HbA1C Test Work?
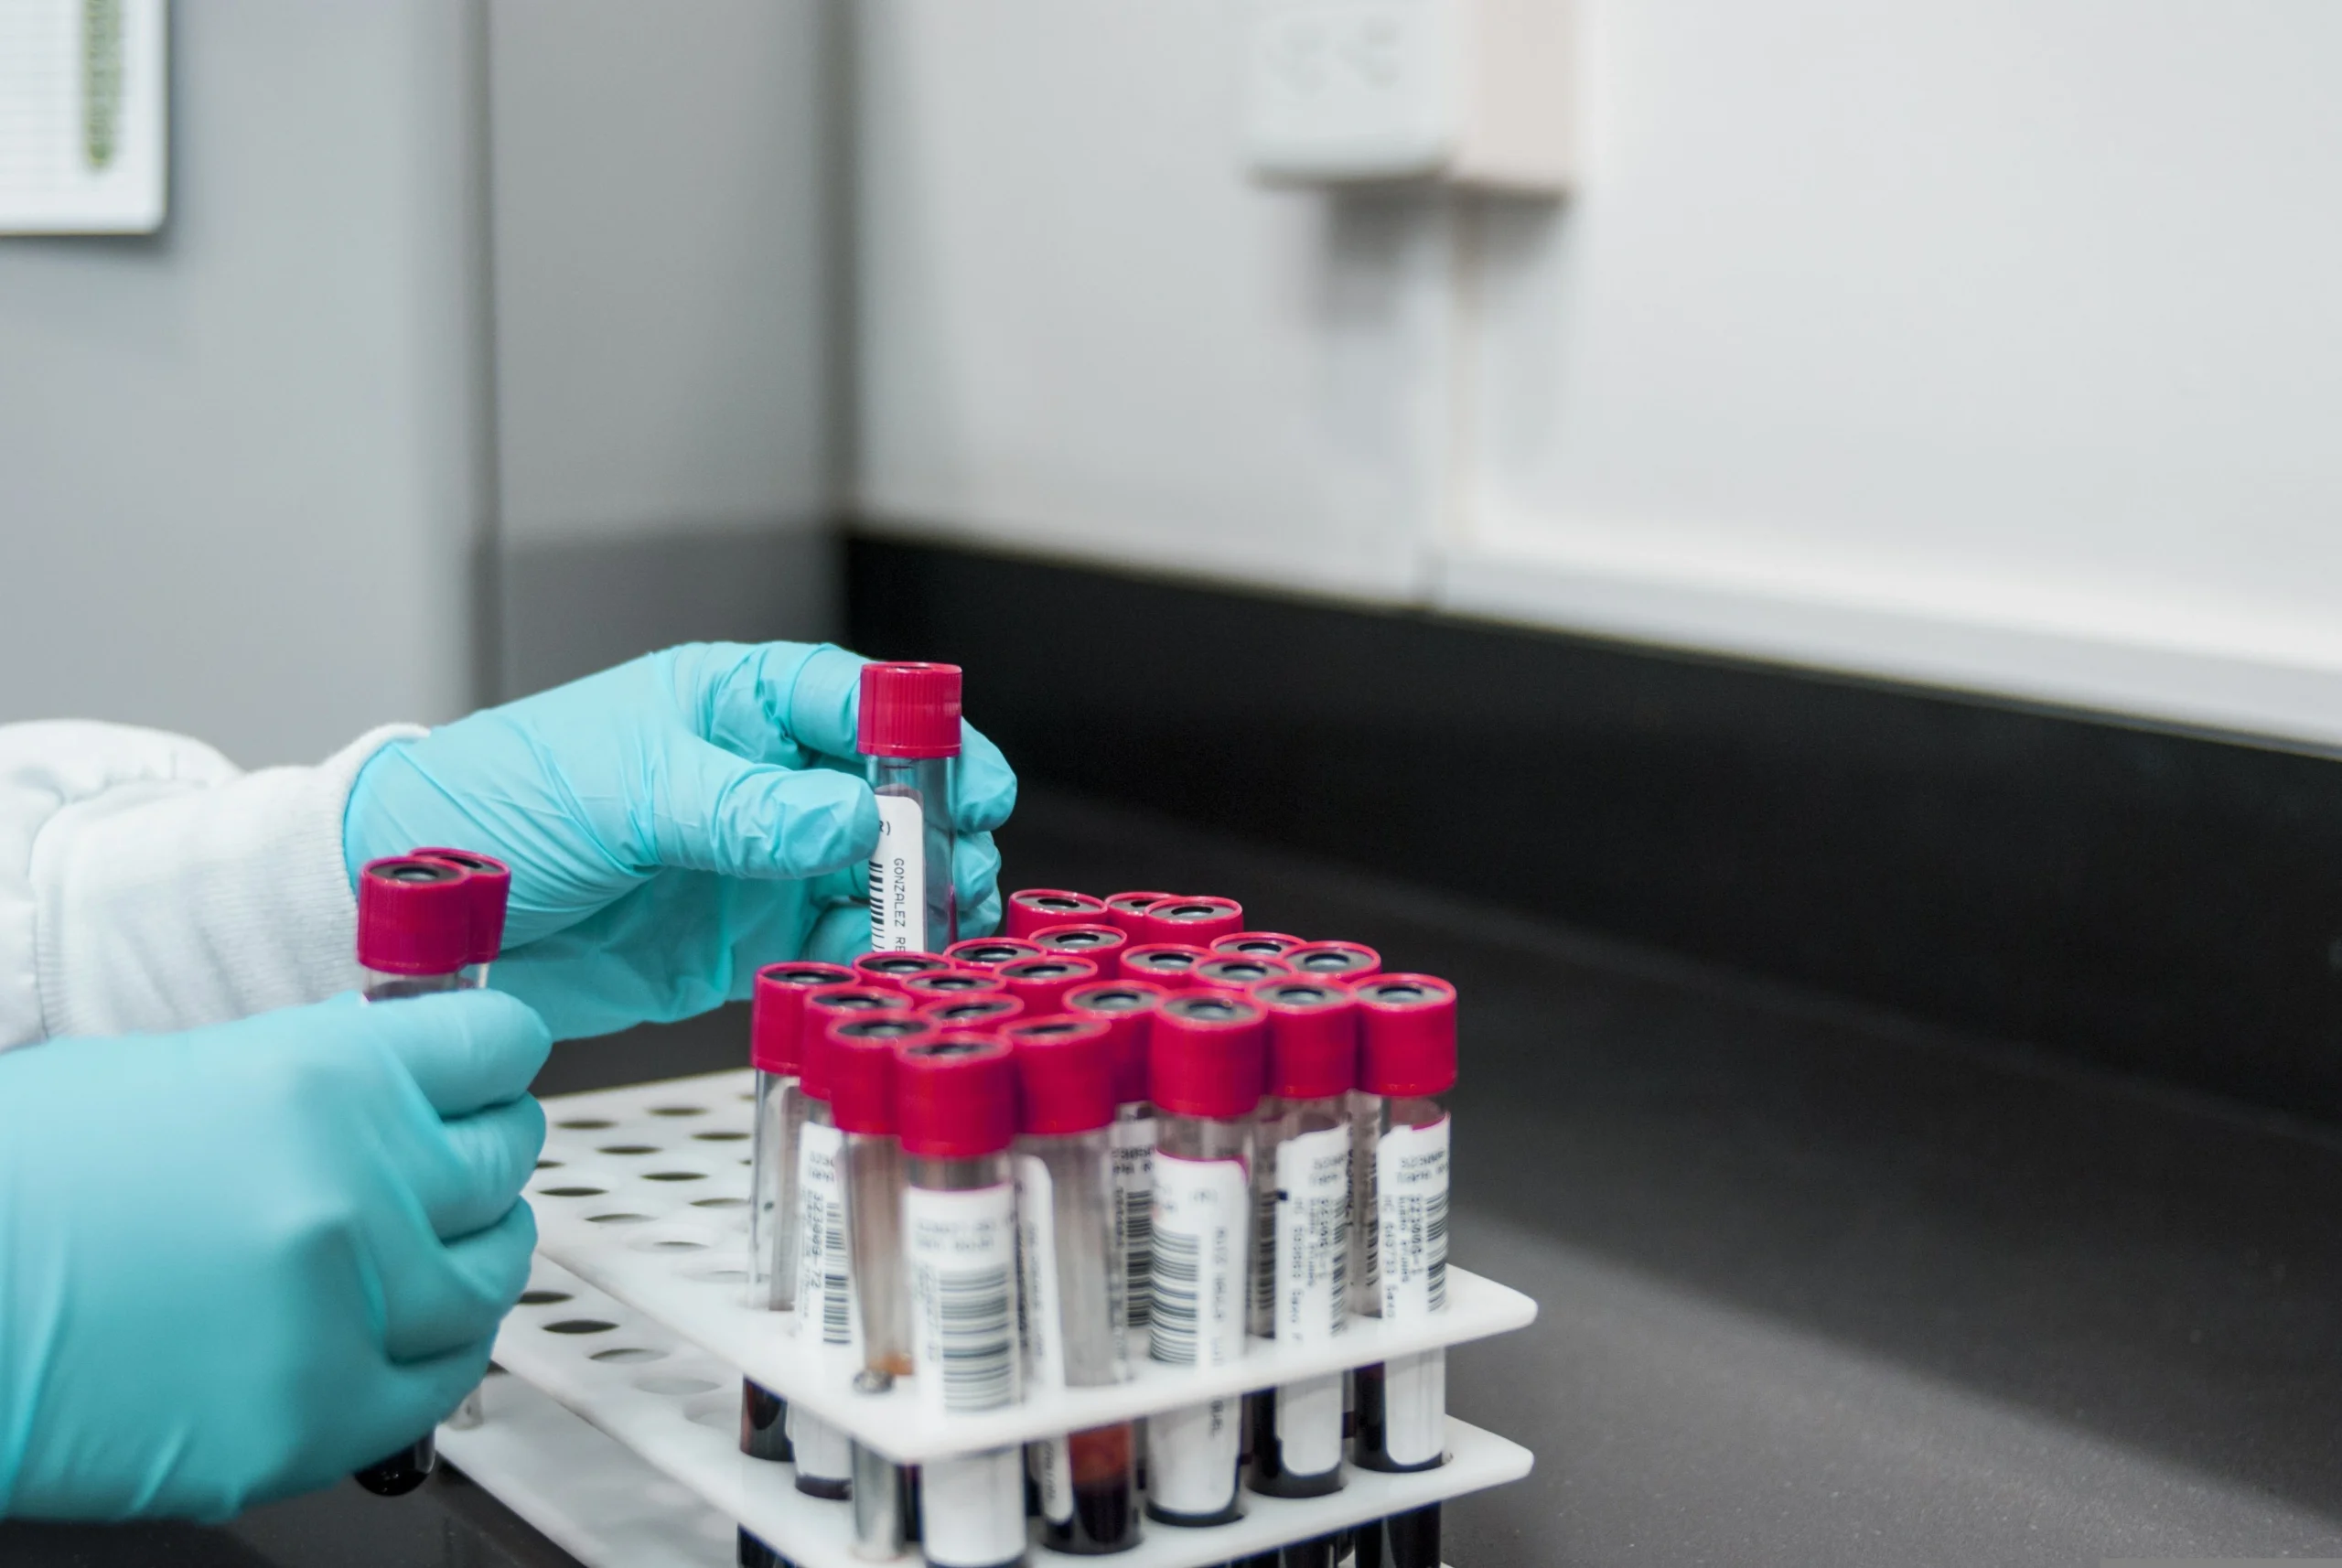
Blood is taken for this test. This test shows how much sugar is attached to your hemoglobin molecules. If your result is 9, it means that 9 percent of your hemoglobin molecules are sugar-coated. Those who do not have diabetes have a result of about 5.
However, if the result is up to 7, it is good, and if it is more than that, it is bad. When sugar is attached to hemoglobin molecules, it is called Glycated in medical language.
Why Does HbA1C Reflect the Last 2–3 Months?
Once hemoglobin is Glycated, it remains Glycated as long as those cells are alive. The life of these cells is about 120 days. For example, now your sugar is under control, but a week ago it was high, so these cells tell you that your sugar was high before.
Because cells keep dying and new ones keep forming, this test is usually repeated after 3 months. If you control your sugar well in these three months, the next test will be good.
However, if someone has developed new diabetes or is pregnant, this test can be done every month instead of every 3 months.
HbA1C and Average Blood Sugar Levels.
There is a close relationship between HbA1c test results and diabetes-related complications. Suppose your daily sugar level is 180, but the result of the HbA1C test is 10. Then it means that your average daily sugar level has been 275 milligrams per deciliter. At the time you checked your sugar, it may have been 180, but at some other time, it may have been 275. In this way, you can identify your mistake and better control your sugar.
Comparison of the HbA1C test with the sugar level.
| HbA1C % | Average Blood Glucose level mg / dl |
|---|---|
| 6 | 135 |
| 7 | 170 |
| 8 | 205 |
| 9 | 240 |
| 10 | 275 |
| 11 | 310 |
| 12 | 345 |
| 13 | 380 |
Correlation between HbA1C level and the likelihood of complications.